
Model capabilities
Compare models across eight dimensions, from intelligence to real-world cost and responsiveness.
Overall intelligence
Compare overall capability across reasoning, coding and knowledge work.
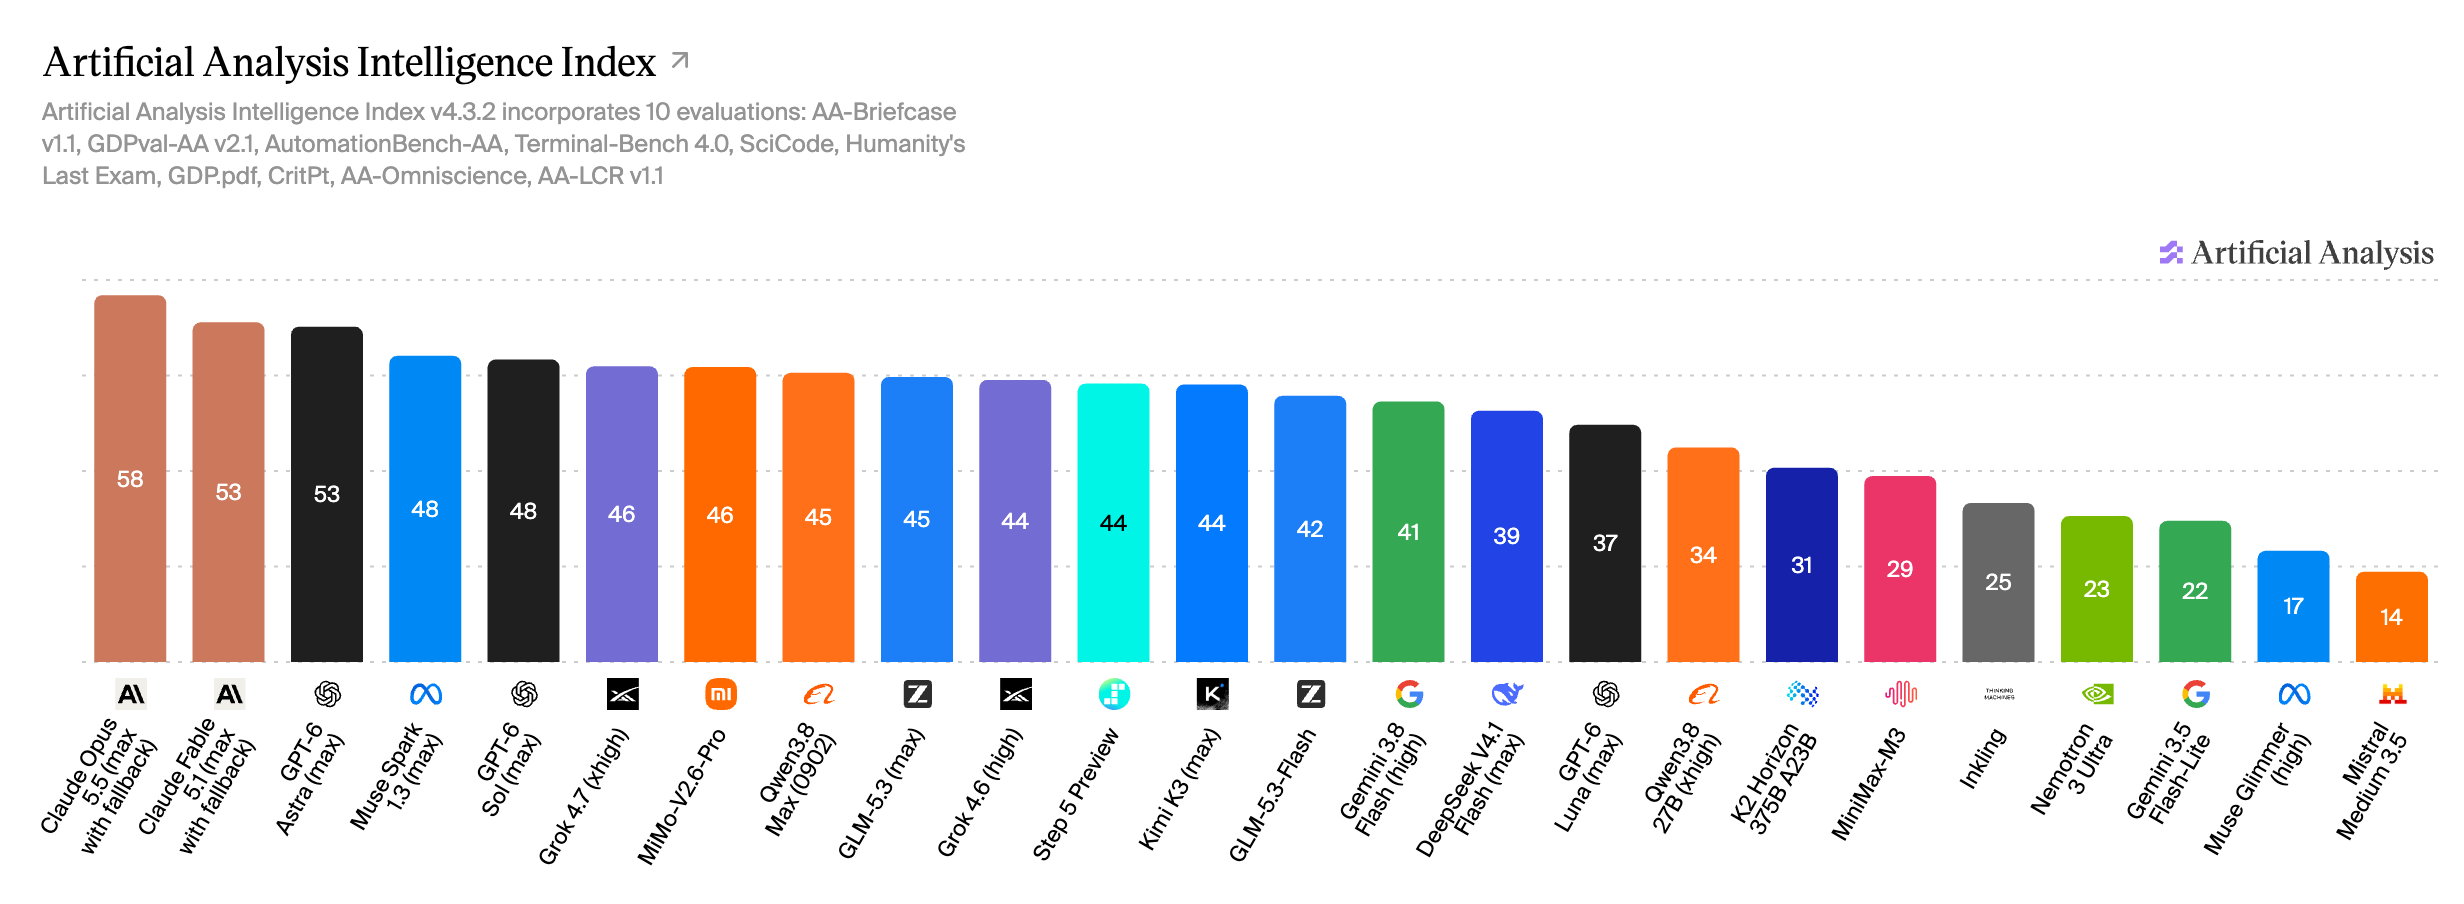
Chart interpretation
Opus 5.5 leads this selection at 58; Fable 5.1 and GPT-6 Astra both round to 53. Reasoning settings remain part of each result.
Specialist evaluations
Explore coding, reasoning, factual knowledge, long-context and visual reasoning separately.
Explore 19 benchmark charts19 evaluations · separate scales
Chart interpretation
Leaders change by task. Use Terminal-Bench and SciCode for coding, AA-LCR for long-context reasoning, and MMMU-Pro for visual reasoning.
Knowledge-work agents
Assess whether an agent can turn a complex brief into a useful deliverable.
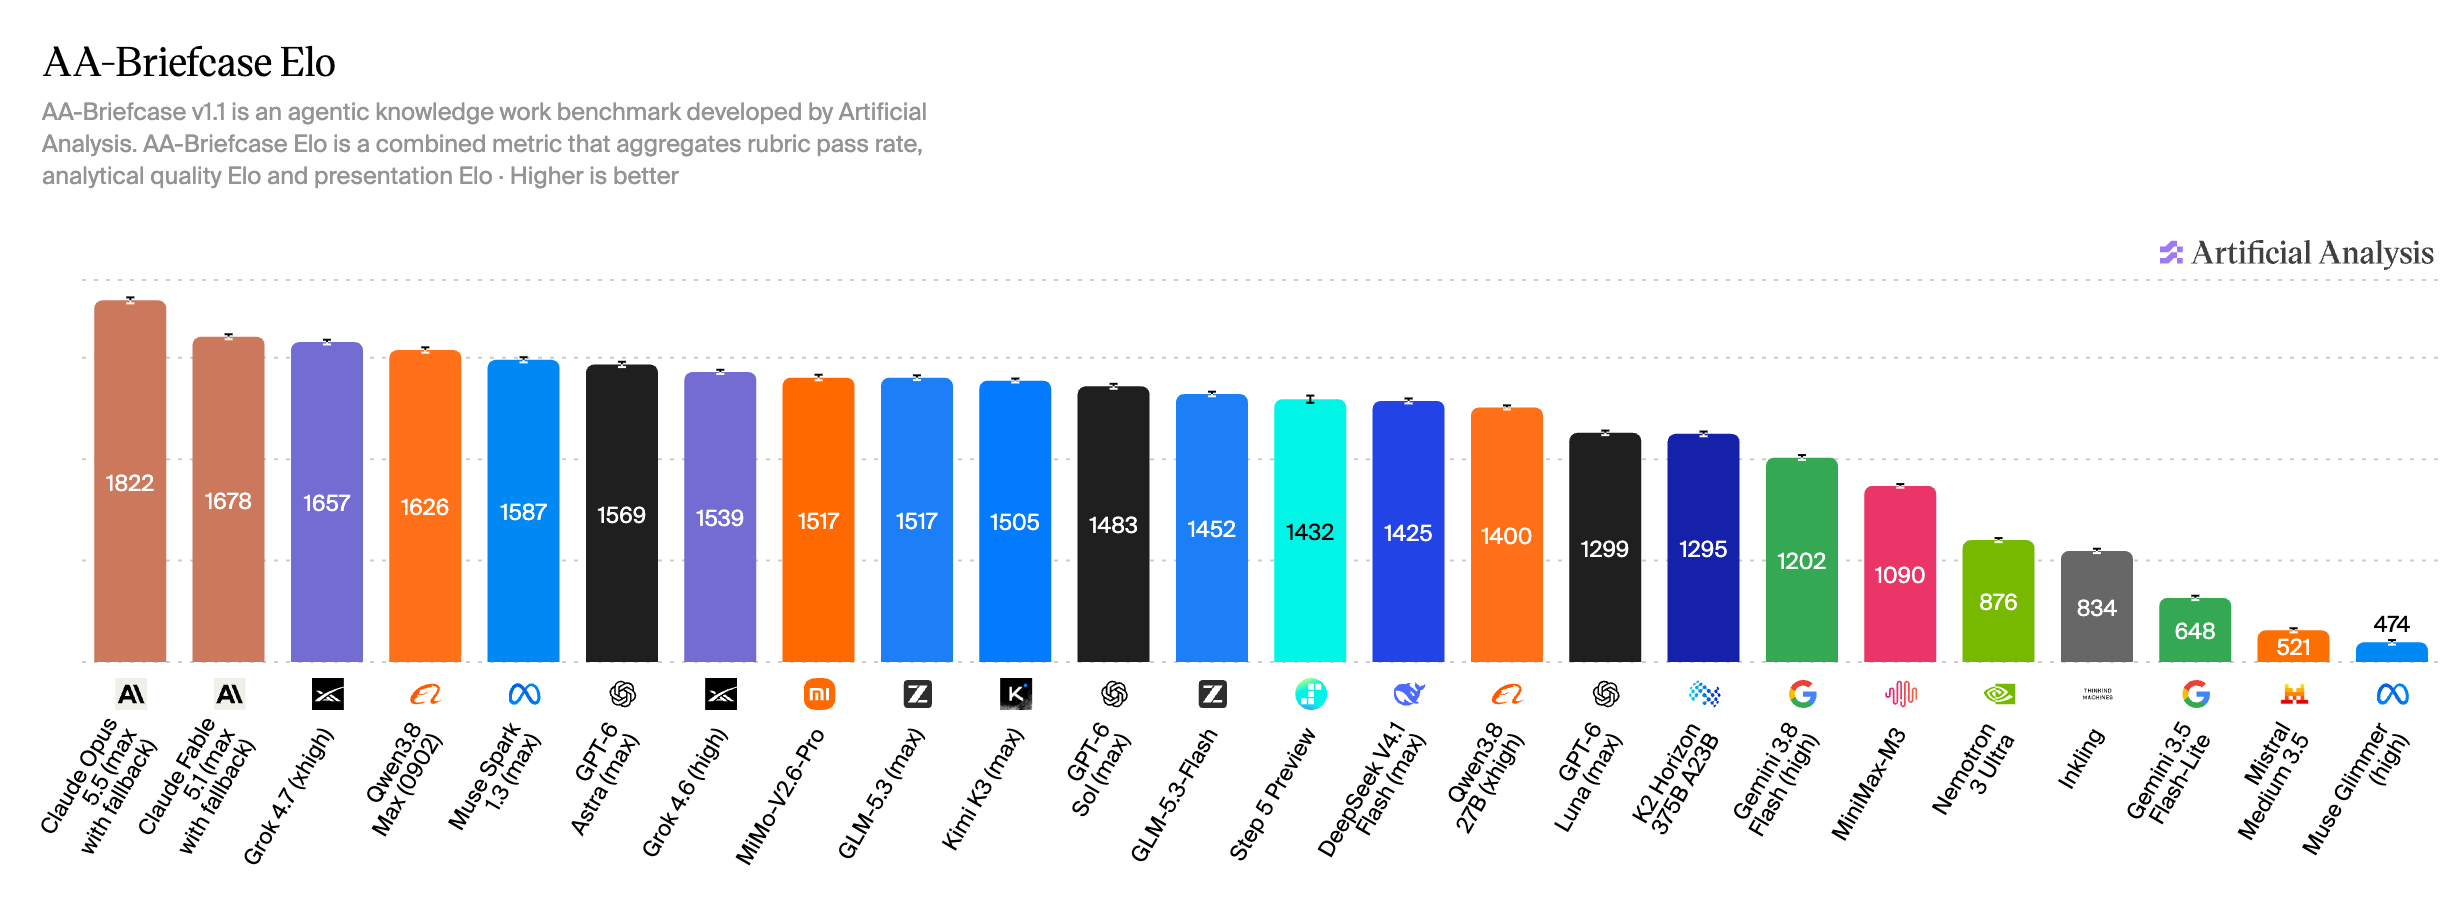
Chart interpretation
Opus 5.5 reaches 1822 Elo, followed by Fable 5.1 at 1678 and Grok 4.7 at 1657 in this selection.
Intelligence and cost
Find the capability you need at a sustainable cost per task.
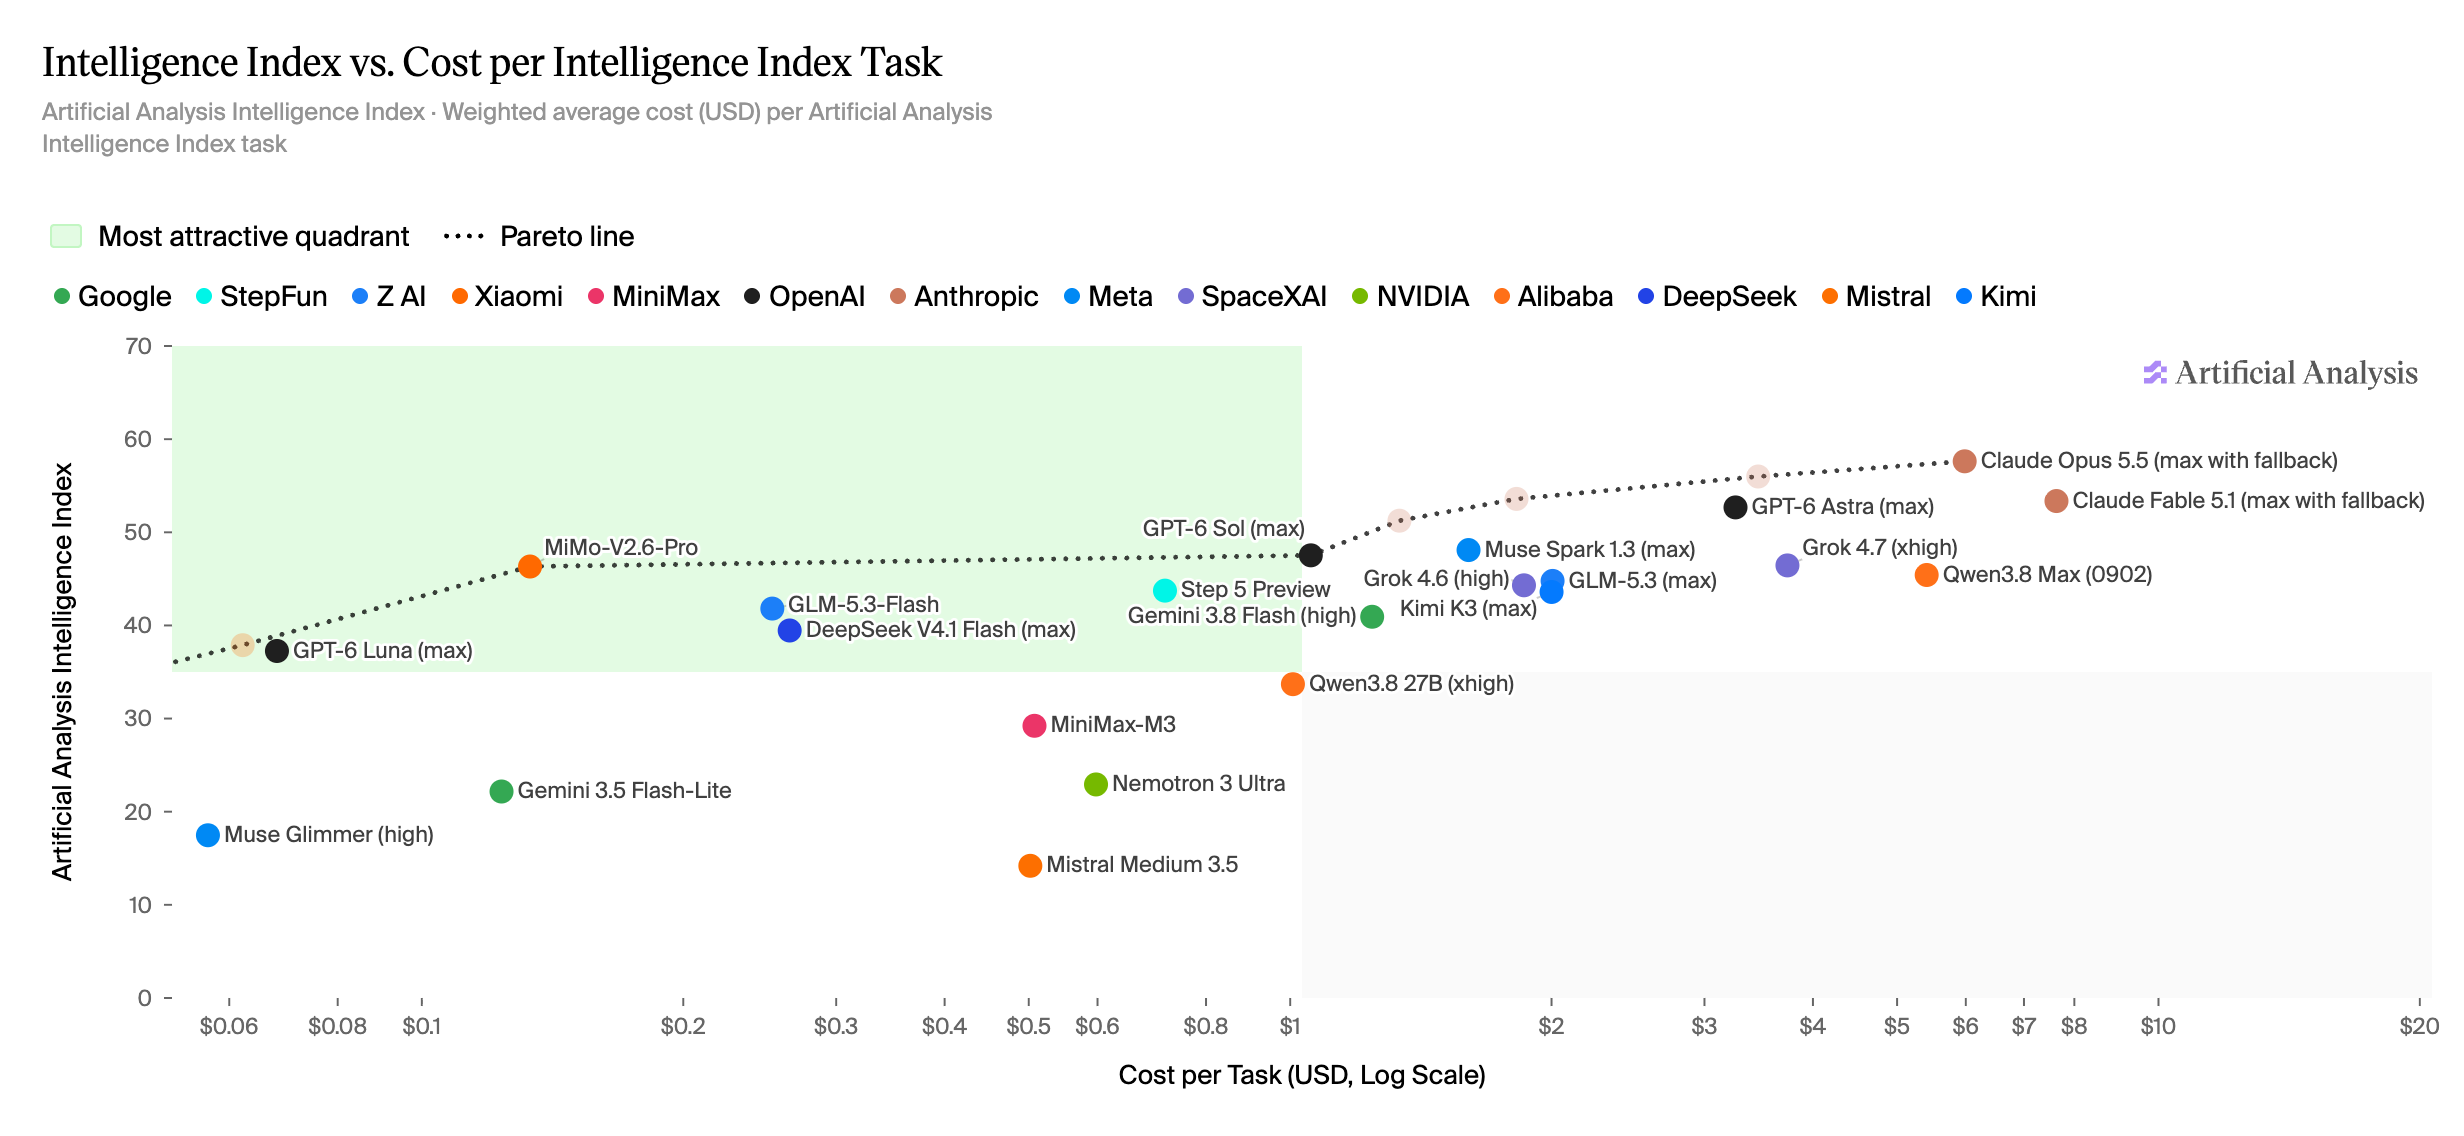
Chart interpretation
The upper-left region combines stronger capability with lower cost. The dotted frontier helps identify efficient choices in the selected models.
Token efficiency
See how much reasoning and answer output a benchmark task consumes.
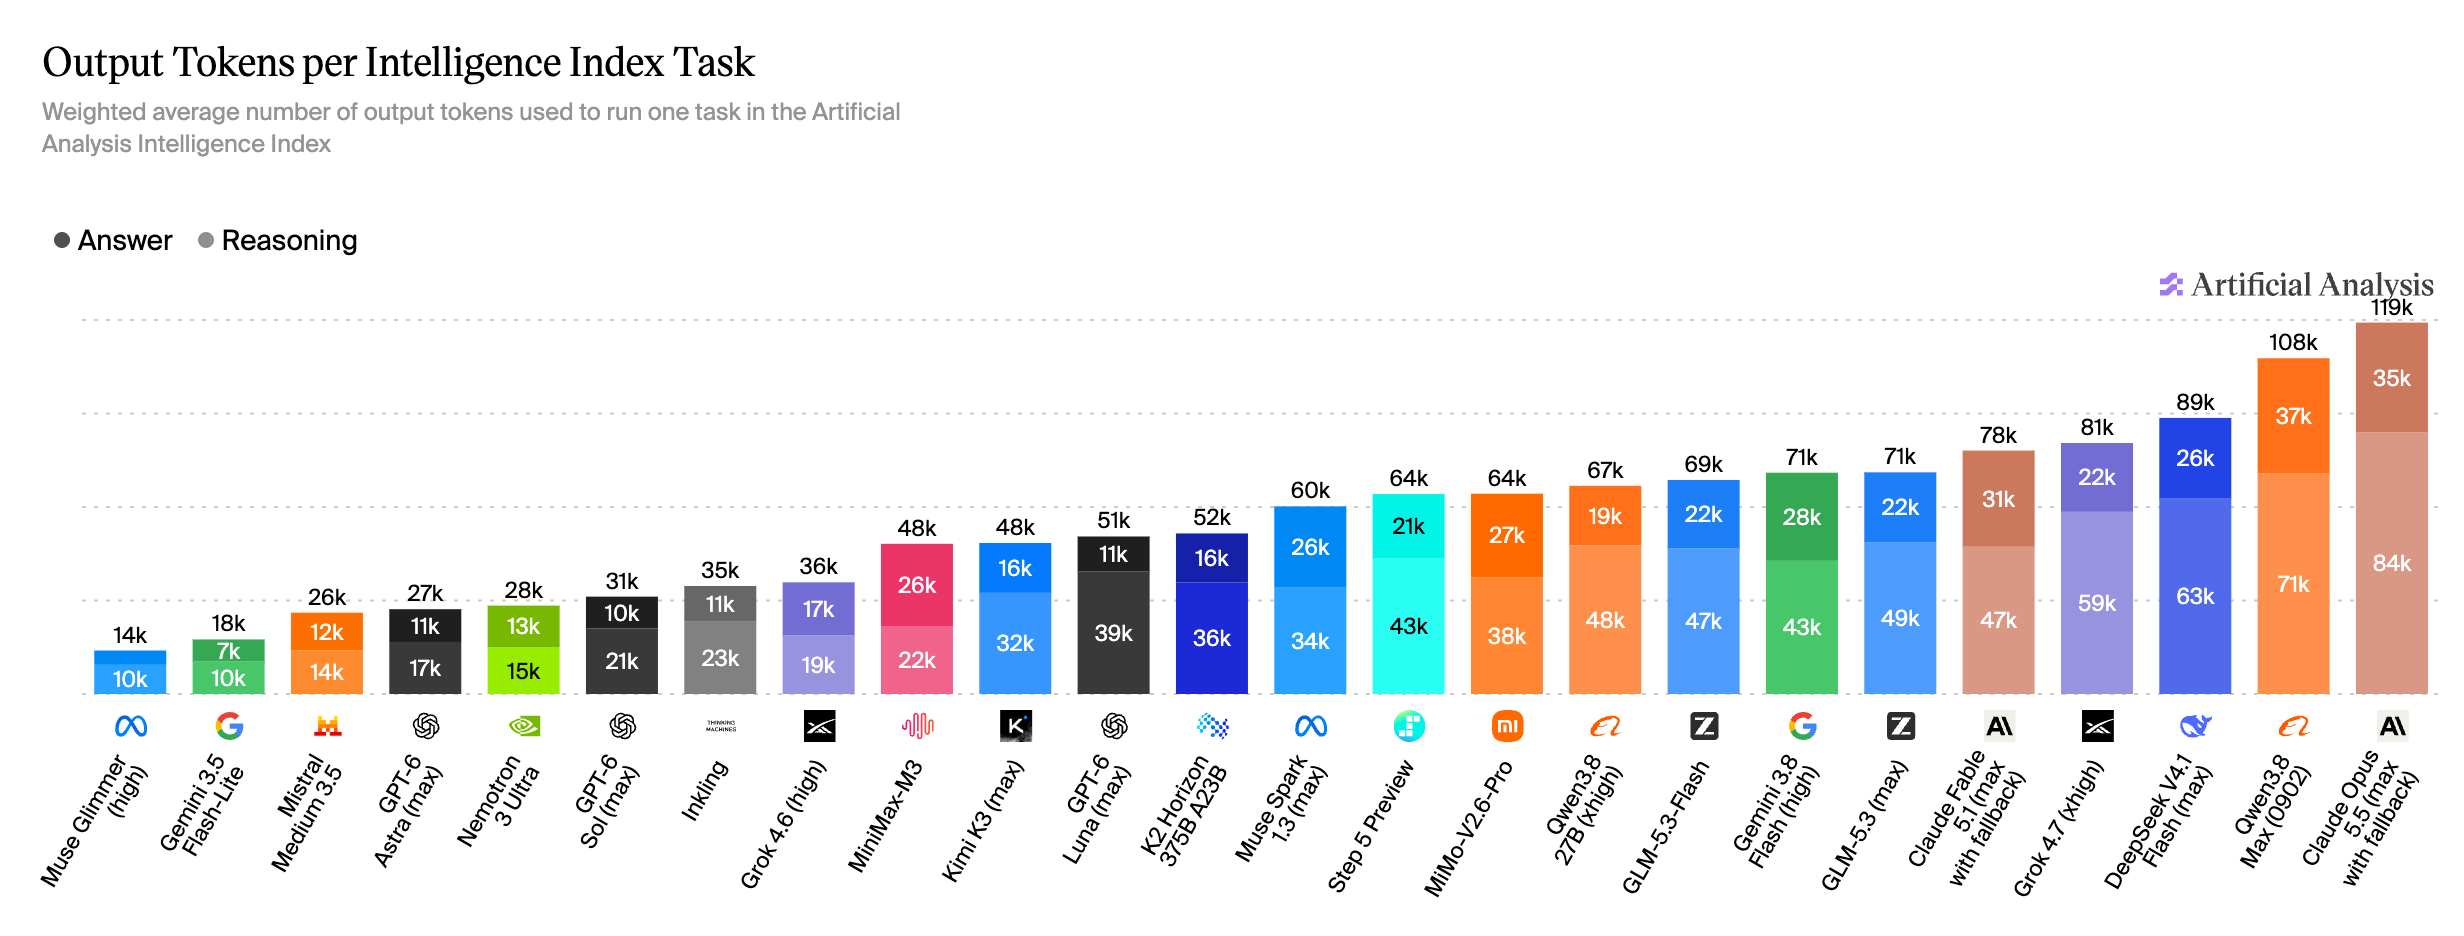
Chart interpretation
Opus 5.5 uses about 119k output tokens per task, versus 31k for GPT-6 Sol. Reasoning tokens account for a large share of usage.
Context capacity
Compare the capacity available for documents, code and conversation history.
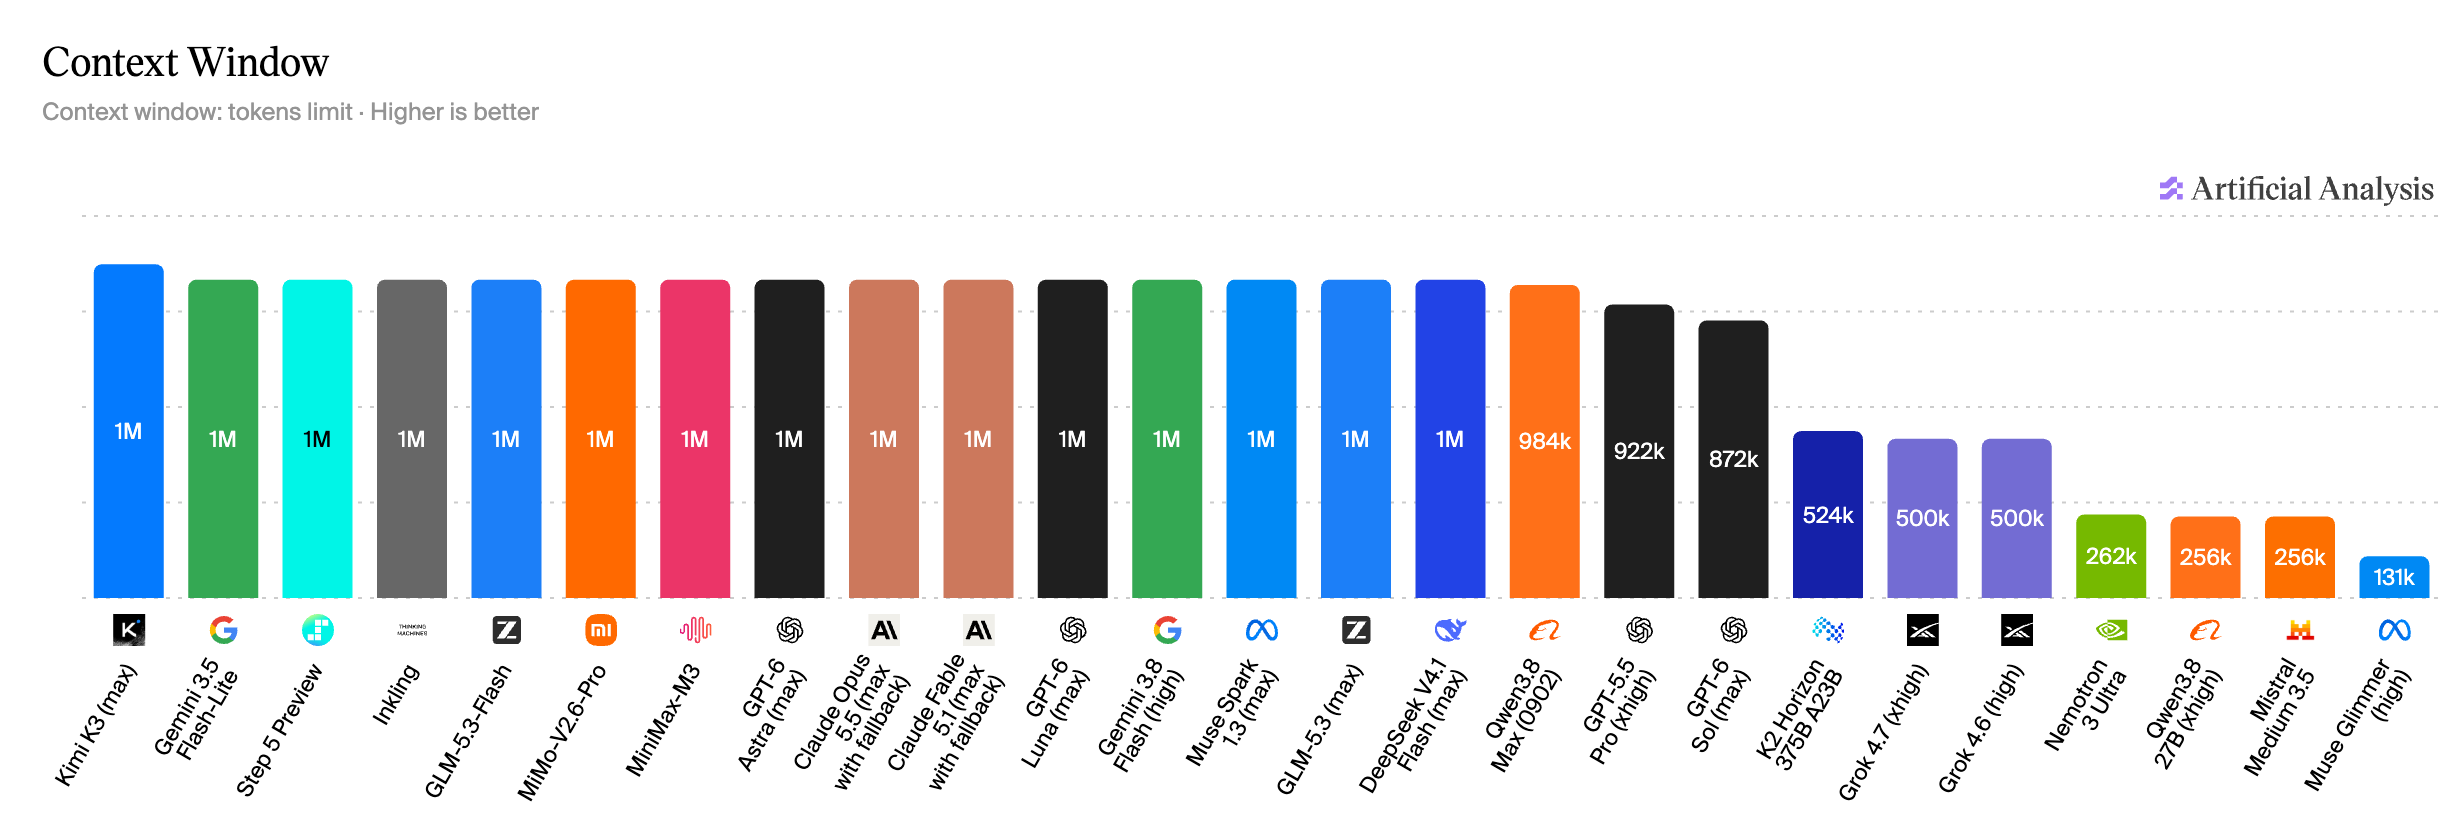
Chart interpretation
Many models in this selection offer around 1M tokens of context; Grok 4.7 is shown at 500k and Mistral Medium 3.5 at 256k.
Output speed
Compare how quickly text arrives once generation has started.
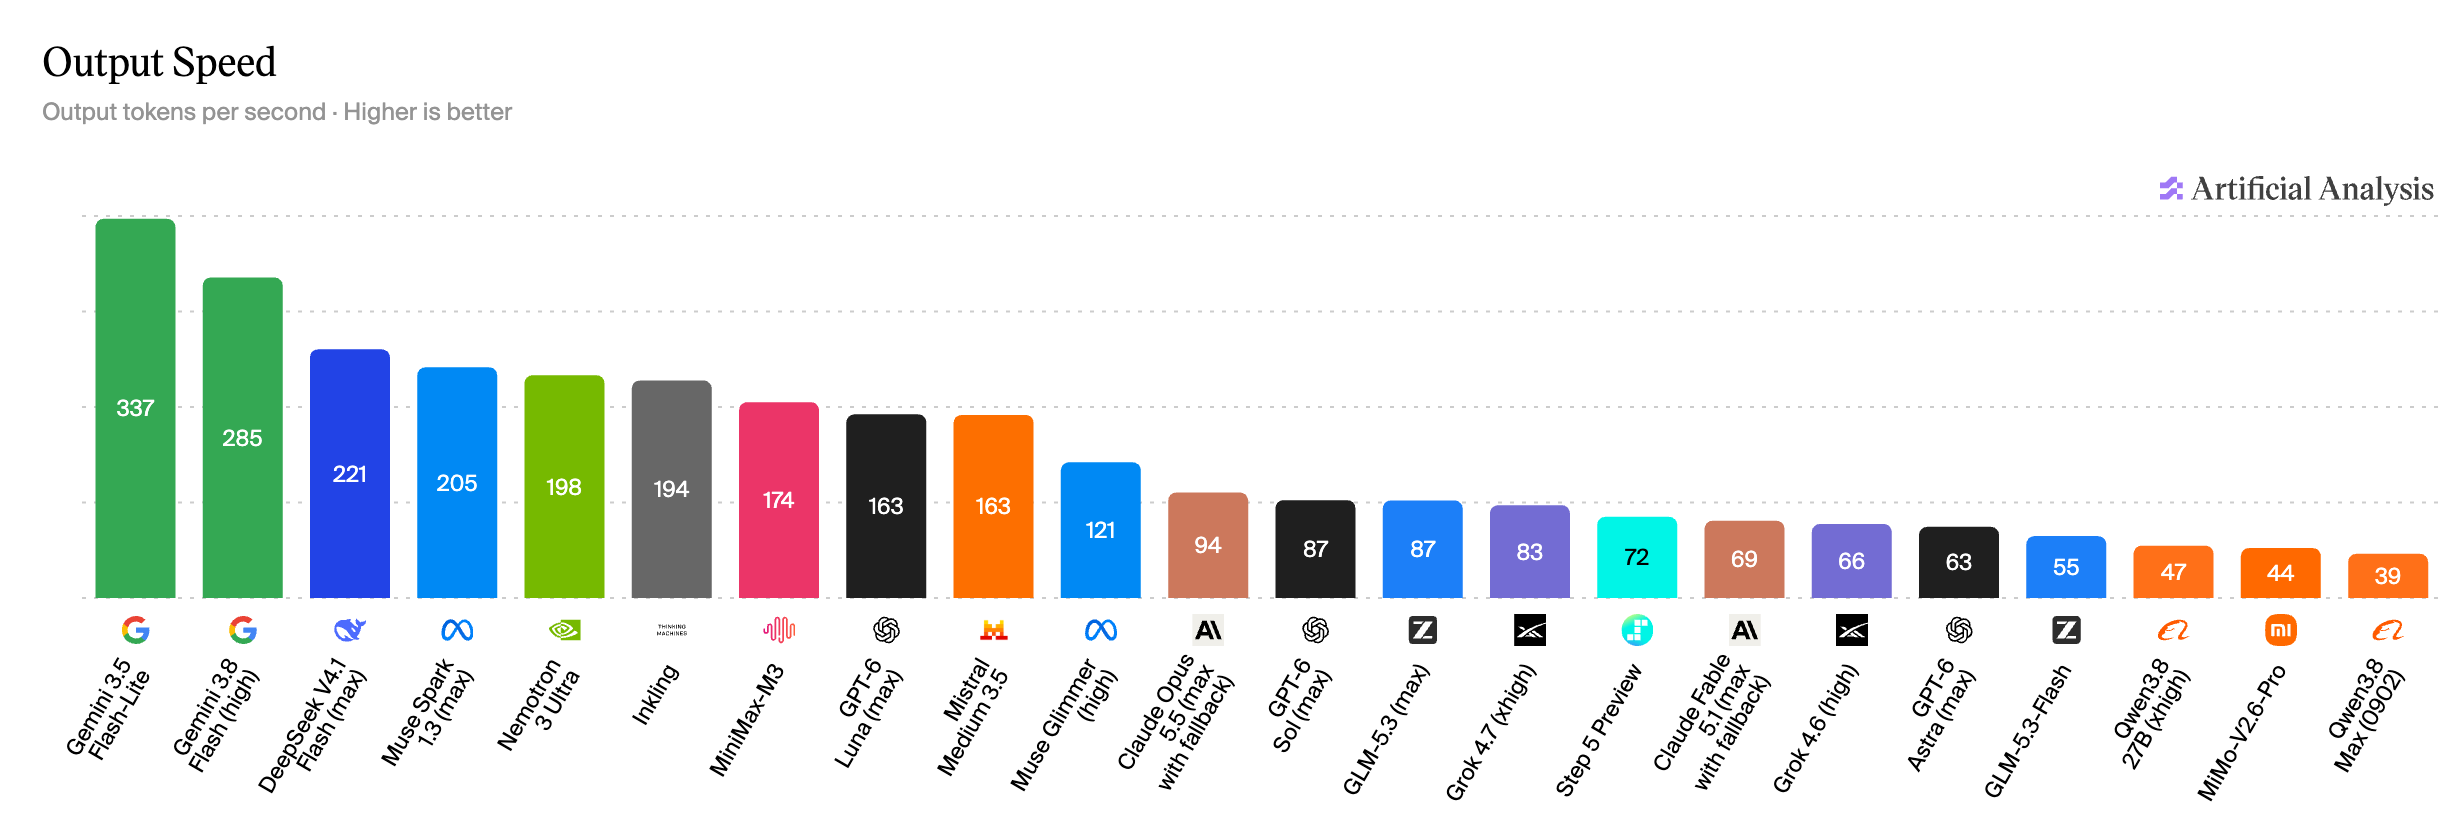
Chart interpretation
Gemini 3.5 Flash-Lite reaches 337 tokens/s and Gemini 3.8 Flash at high effort reaches 285 tokens/s in this selection. Faster output can improve long-response delivery.
Time to first answer
Measure the wait before the user receives the first answer token.
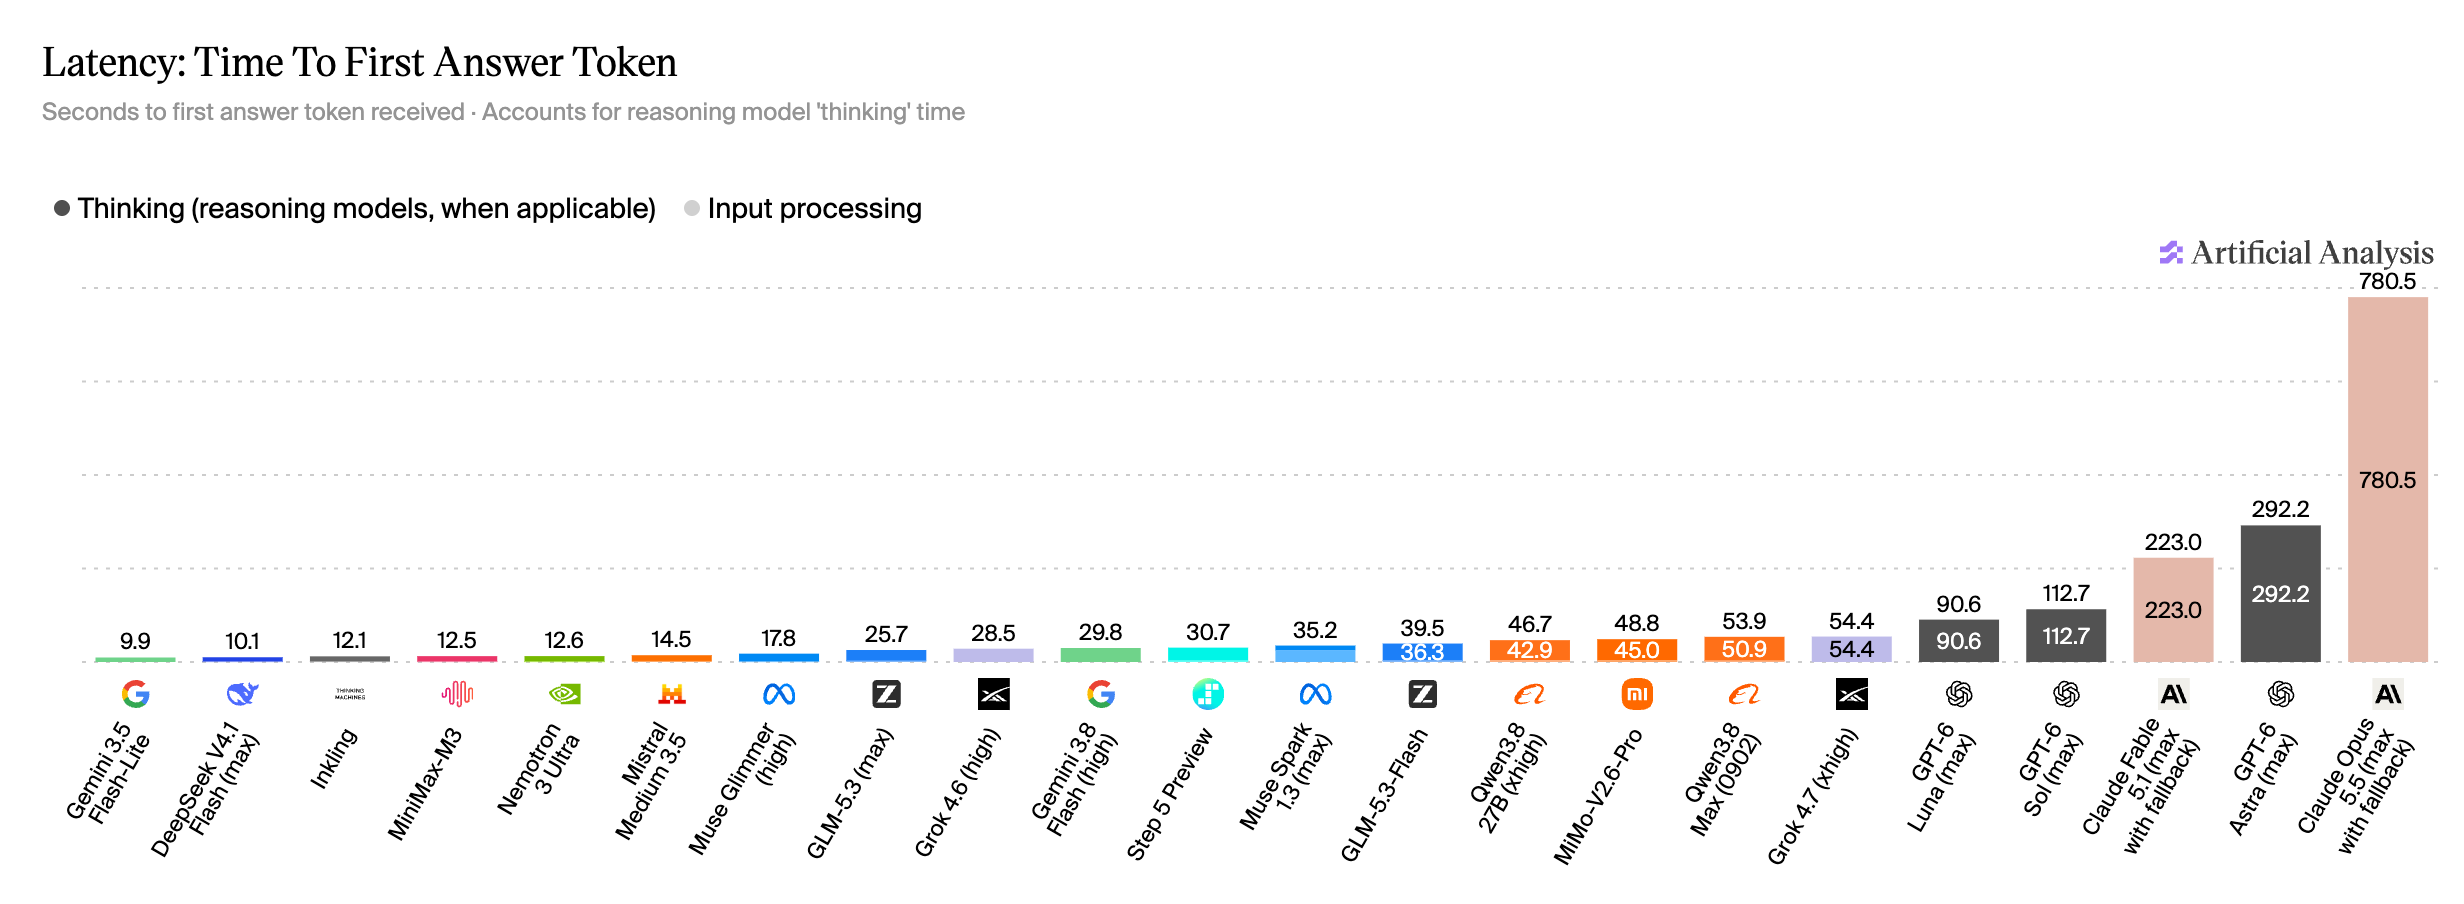
Chart interpretation
Grok 4.7 at xhigh effort is shown at 54.4 s, while GPT-6 Astra at max effort takes 292.2 s. Thinking time can dominate the perceived wait.